Video Data Visualization
Visualize numbers, trends, and statistics within an engaging video. Help your users and customers understand information clearly and quickly.
Unfold the data complexity with video data visualization
Data is an incredible source of value that provides a competitive advantage to businesses and helpful information to users and consumers. However, with millions of data being generated every day at increasing volumes and complexity, explaining what’s important without creating frustration has become a real challenge.
Data visualization is here to put things in order. By giving a clear and simple visual representation of complex datasets and statistics, data visualization makes it possible to easily predict trends, find patterns, and make better decisions. Even more importantly, it helps viewers and customers understand information clearly and quickly.
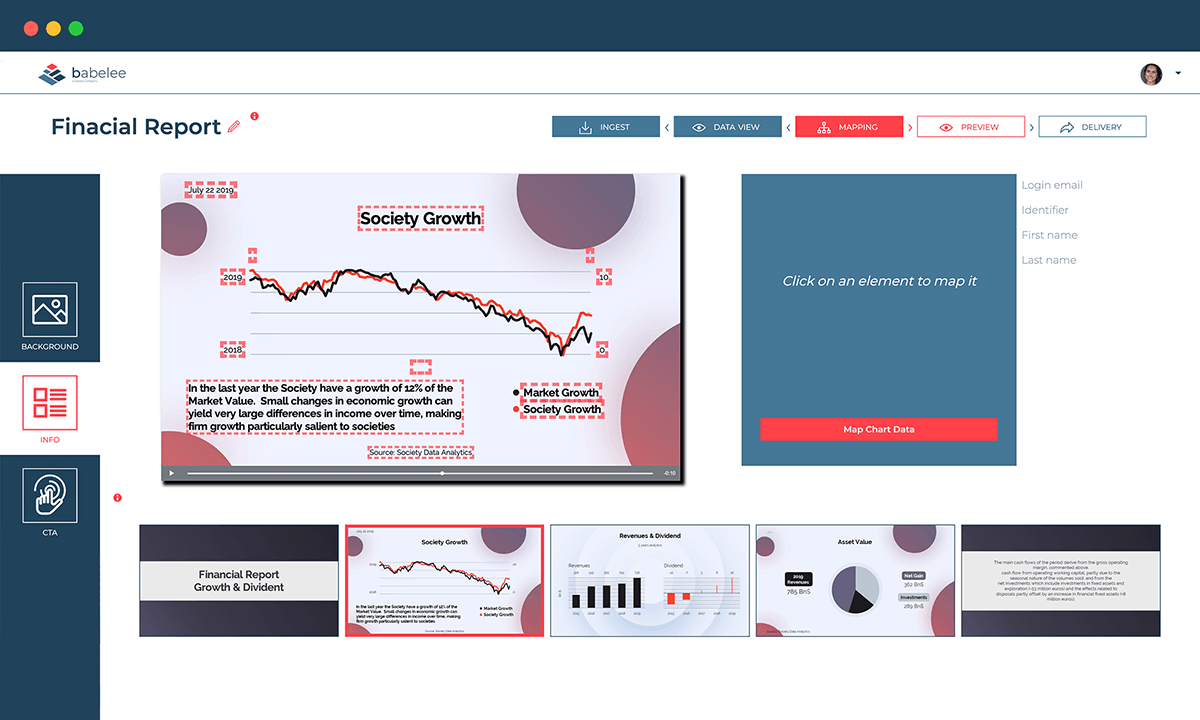
Thanks to video data visualization provided by Babelee, you can go a step further and combine data visualization with the effectiveness of video communication. You’ll be able to share and visualize numbers with users and customers in an easy, automated, and engaging way. Fully exploit the power of your data using the video format, which is attractive by nature.
With Babelee, you’ll be able to easily create personalized videos that show relevant trends and clear reports, in addition to useful tables and percentages. Each video is unique and easy to understand, and each graph tells a story and inspires actions that users can perform.
Start creating your data visualization video in just a few steps. From the platform, you’ll be able to choose between different types of graphs in a variety of available styles, customize your video template to give a personal touch to your project and, finally, link your data source full of valuable information. Great job! Now see how your data comes to life while it tells a unique and compelling story in a clear and effective way.
Make it easy to report personal, financial, biometric, or any other complex type of data, create compelling video reports and video infographics, and unfold the complexity of data with the simplicity of a video. Video data visualization is made easy with Babelee.
The power of video data visualization
Did you know that people remember only 20% of what they read but 80% of what they see? This is one of the main reasons why visual communication has become increasingly important in recent years, and it’s notably impacting digital strategies around the world.
Video data visualization provided by Babelee will help you create incredible but easy-to-understand videos, allowing you to make a lasting impression on your users and customers.
First of all, you’ll be able to explain data in a simpler way, making it easier for customers to understand precious information. Therefore, you’ll also increase engagement and build stronger relationships, thus improving the effectiveness of your whole communication strategy. And remember: if you bring value to your customers, they’ll return it back to you. So, if your customers have a better understanding of what you want to say, they’ll be more likely to do what you want them to do. In other words, video data visualization can also have a huge impact on conversion rates and the overall return on investment.
Starting right now, data visualization videos will enrich your marketing toolbox, improving your digital customer experience and making you one of the most engaging data-storytellers out there. Let Babelee surprise you.

Discover video data-visualization
Babelee has a new superpower! Thanks to video data visualization, the platform allows you to easily explain complex data and statistics using the immediacy of video communication. We’re talking about a new outstanding and effective way to engage your users and customers: understanding percentages, distributions, and trends will no longer be a problem for them. In just a few steps, you’ll be able to send useful monthly and annual reports, video summaries, or video infographics that will get them straight to the point. Give your customers the power to understand. Make them feel like the hero of their own story.
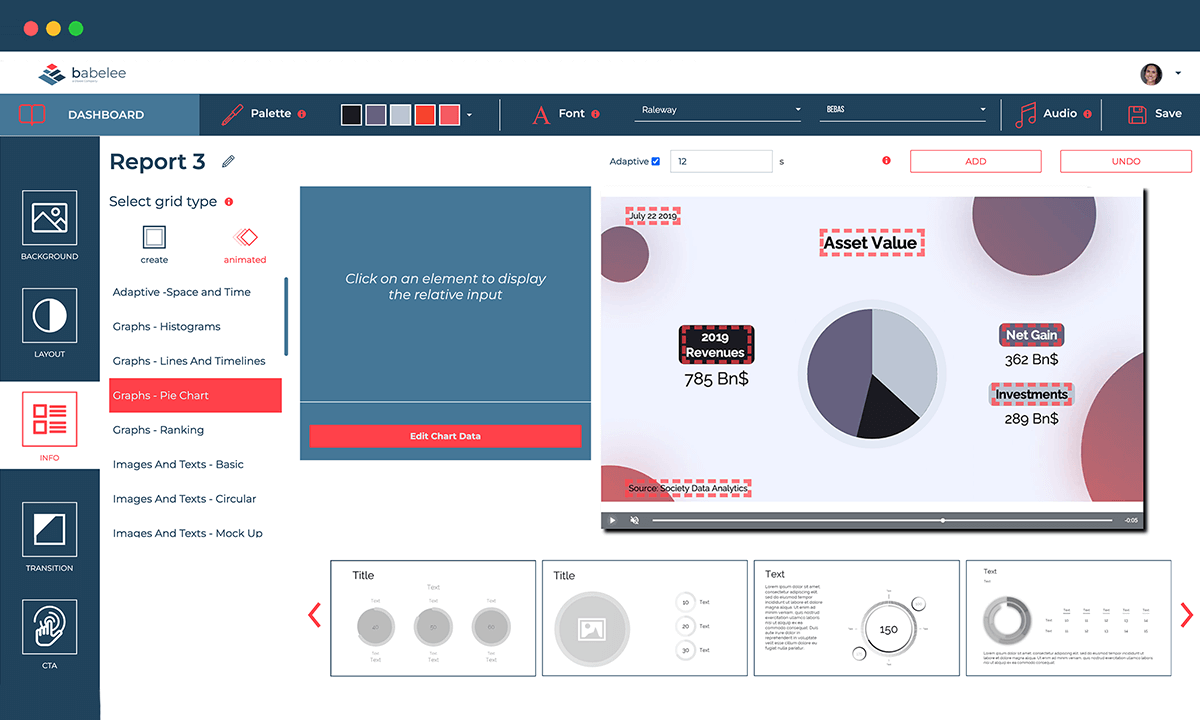
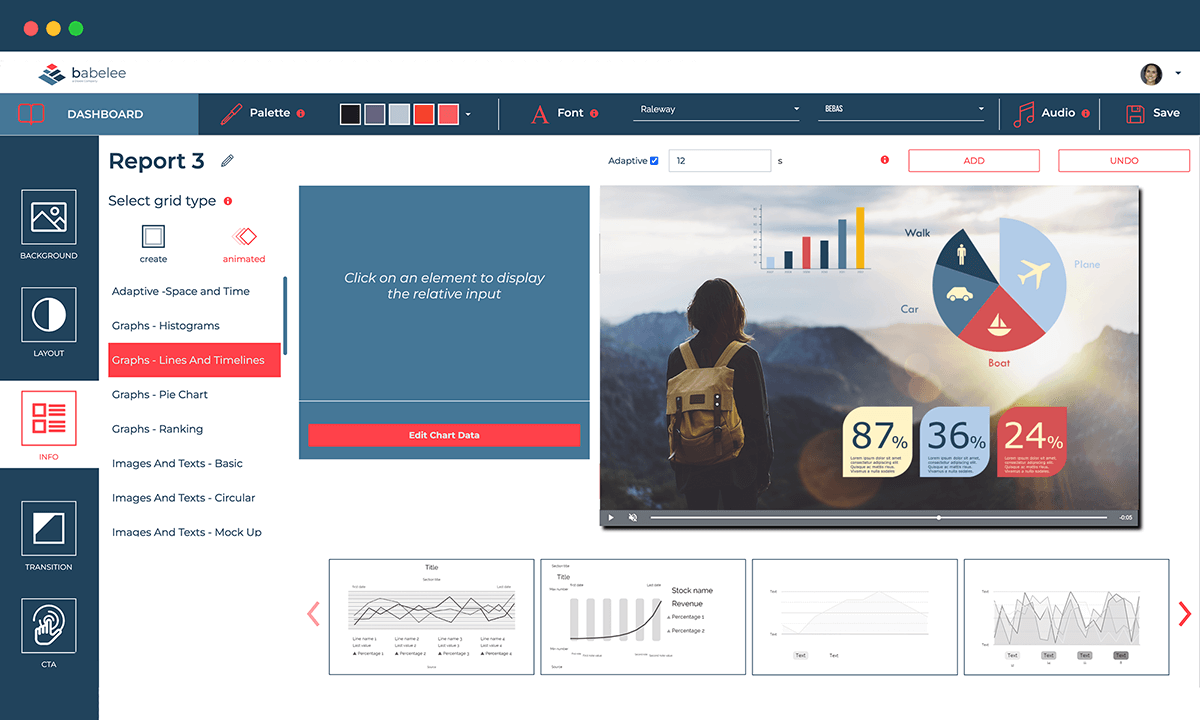
Show trends with animated graphs
Sometimes graphs can be overwhelming. But they don’t have to be, especially when show them using a compelling video. In Babelee, you’ll find lots of animated histograms, lines, pie charts, and rankings in different styles, ready to visualize trends, expenses, investments, and whatever you want. Just pick the graph that best fits your needs and place it in the scenes of your data visualization video. Then, bring it to life with the precious data that you have available. Well done! Now, get ready to impress and engage your customers in a new and easy-to-understand way!
Inspire with data storytelling
Video data visualization is not just about cold percentages and soulless trends. There’s a story within those numbers that is waiting to be told and a value that needs to be communicated. By combining data visualization with video personalization, Babelee allows you to use your data to tell a unique story to each of your customers, thus unlocking new possibilities to grab their attention and engage them. As in the most adventurous stories, your video will show, scene by scene, the right path to take and the best actions to perform. And they all live happily ever after!
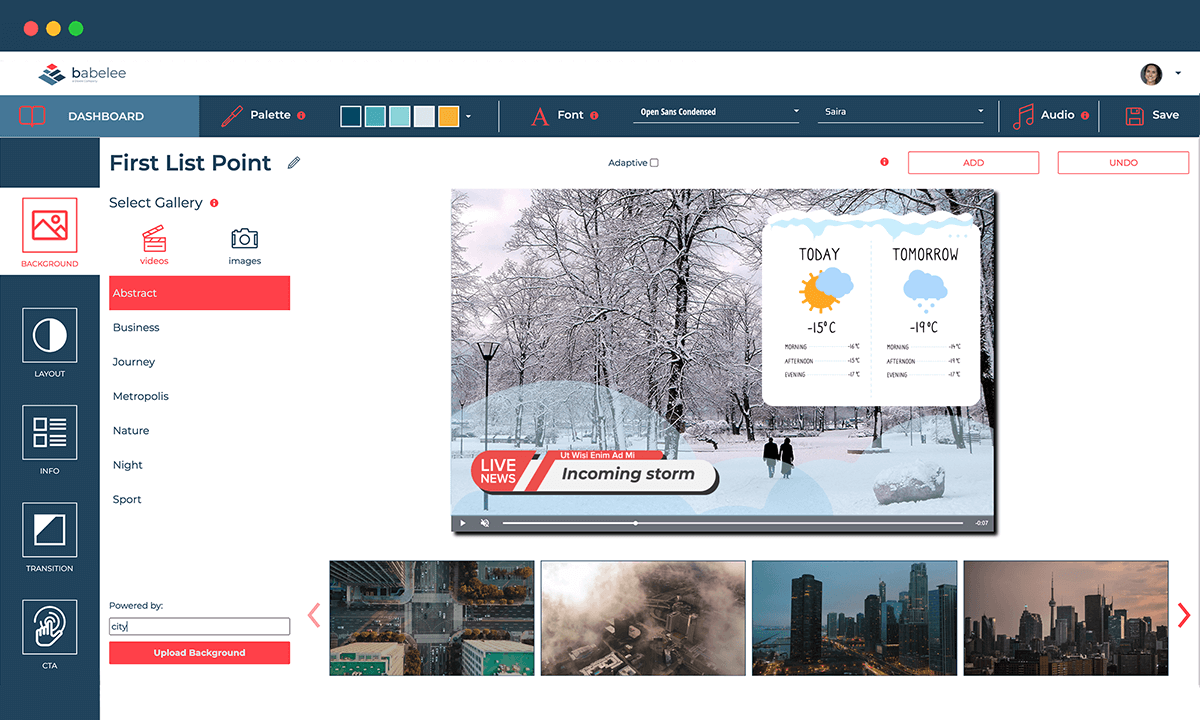
Create attractive video news
We know that every day, publishers deal with tons of data that they can show or use in their news: from political polls to weather reports, from economic growth data, to demographic statistics. This is a challenging amount of information that needs to be simplified and effectively communicated to readers and viewers in order to deliver a clear and understandable message. Why not use a data visualization video to make your news shine? With Babelee, you now have a new, appealing way to turn your data into an engaging video that will surprise your readers and improve your daily work.
Surprise with a real-time video
Traditional MP4 videos are static and unable to change. Once created and watched, they can’t communicate anything new. With Babelee, this isn’t the case. The Babelee platform allows you to create data visualization videos that can be updated in real time! After linking your external data source, you’ll be able to dynamically update your graphs and any other content within the video, thus providing current and valuable information to your users and customers. Reshape your video news and the creation of video infographics, and reshape your idea of video communication.
Link data at lightning speed
At this point, you know everything about video data visualization! But how can you link your data to Babelee in order to create amazing video reports? The platform has many different ways to import your data within your data visualization video. For instance, you can upload a CSV file containing the rows and numbers you want to visualize. You can also link your data through APIs or even take news text automatically from RSS feeds. No matter your choice, your video will be ready to be shared and watched in just a few steps.


Place the video where you want
Your data visualization video is ready! What are you waiting for? Just deliver it by email, SMS, social networks, in-app push notifications, or any other channel you prefer. You can even embed it into your blog posts and web pages to enrich your text content with a clear, interactive, and engaging video. The right choice is up to you and your digital communication strategy. What really matters is that you start communicating numbers and stories in a new and simple way. And with Babelee you can’t go wrong.

5 tips to create an effective explainer video
Download the infographic to discover how to create better explainer videos for your business!